How to integrate Grafana/prometheus in your DAppNode Package
This is a more detailed guide on how to integrate into your DAppNode package Prometheus/grafana.
WE RECOMMEND TO INTEGRATE THIS FUNCTIONALITY ONLY IF THE PACKAGE REQUIRES BECAUSE THIS KIND OF SERVICES USES HARDWARE RESOURCES
You can see how DMS package works in the next link https://github.com/dappnode/DMS
1. Create the prometheus-targets.json
We have to create this file and include it in our DAppNode package. The format of this file is the next:
[ { "labels": { "package": "avalanche.public.dappnode.eth", "service": "avalanche.avalanche.public.dappnode", "__metrics_path__": "/ext/metrics" }, "targets": [ "avalanche.avalanche.public.dappnode:9650" ] } ]
Every package requires some data, for example, if the package exposes its metrics in a path like the above example, you will need to use the label __metrics_path__ but if your package exposes its metrics on an endpoint like package:9595 this label is not necessary.
In the package label: you need to write the package name.
In the service label: you need to write the service-name defined in the -docker-compose of the package + name of the package.
After adding this file with the adjusted content in your package. To test it. We do (remember to stay connected to a dappnode VPN):
dappnodesk build
Copy the hash and install the package in your dappnode.
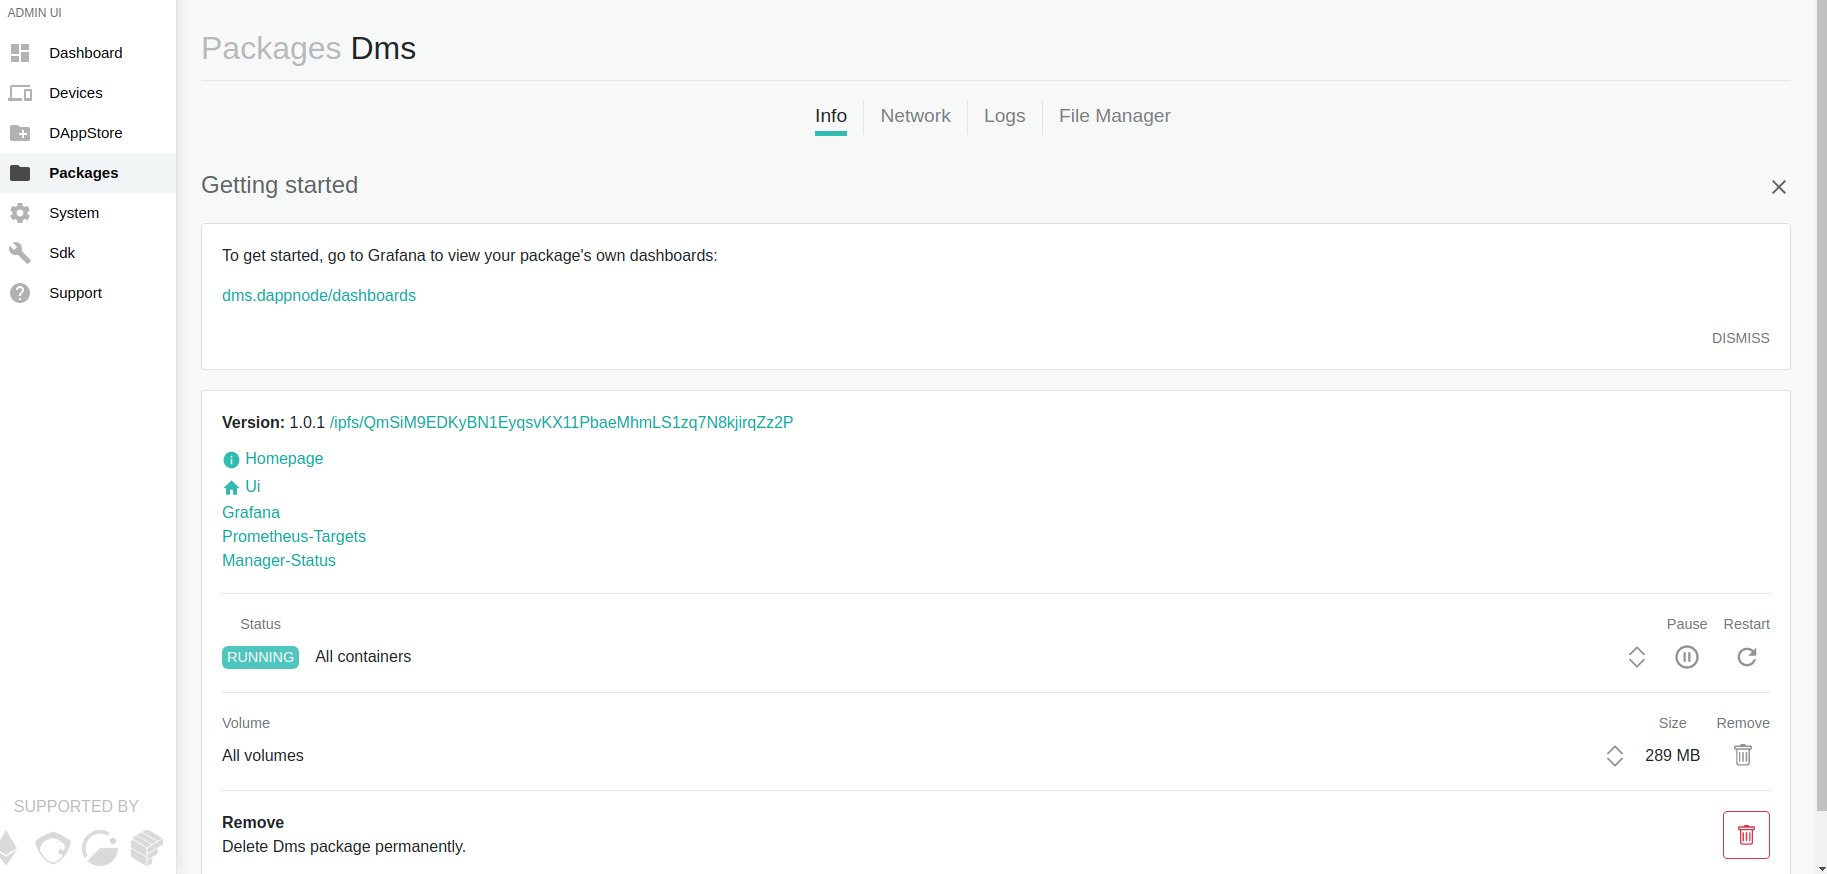
Go to the DMS package and click on Prometheus-Targets:
Then to check it out, search metrics you have added. In this example case, we added avalanche metrics, if all the thing went well will see avalanche metrics.

If you don’t see the metrics you are awaiting, you should go to Packages > DMS > logs and select manager:
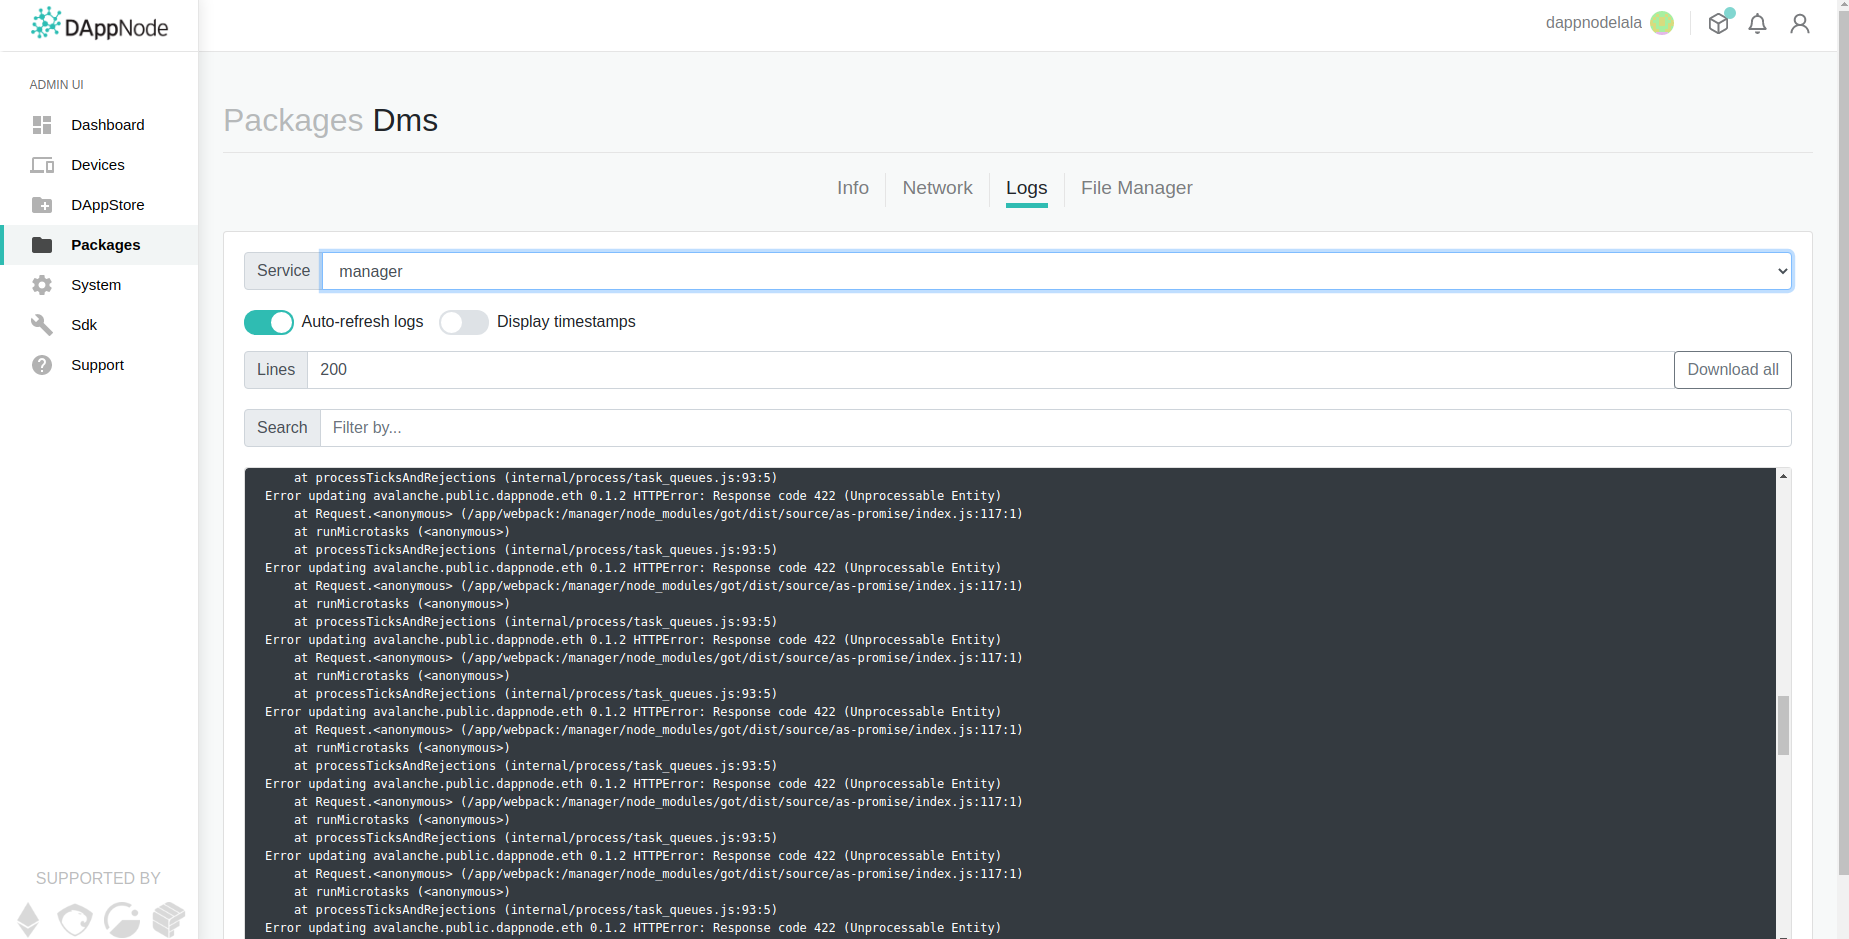
Here you will see what is the error, and we can help you with that.
Then, the first step is done. Our DMS package is receiving the data of the package we want. The next step consists of creating a dashboard for grafana. So the users don’t have to create all the panels by hand.
2. Create -grafana-dashboards.json
You have to create your grafana dashboards on dappnode and export them. Go to Dashboard Setting, JSON Model.

Copy the content of this file and paste it in the file you have created with the name package-grafana-dashboards.json.
After including these two files, dappnodesdk build and install the package and check you have all the dashboards.